Free React Stats & Metrics Components
Every marketing site claims numbers; the credible ones present them like they have been audited. These eight give metrics that register: a stats band for headline figures, a bar list and composition bar for breakdowns, an activity grid in the GitHub contribution idiom, a compare layout for before/after arguments, a live board for operational theatre, prose-inline stats that sit inside sentences, and a stats story that sequences numbers into an argument. Tabular numerals and sourced-figure slots throughout, because a stat without a source is a vibe.
8 components · MIT licensed · installable with the shadcn CLI
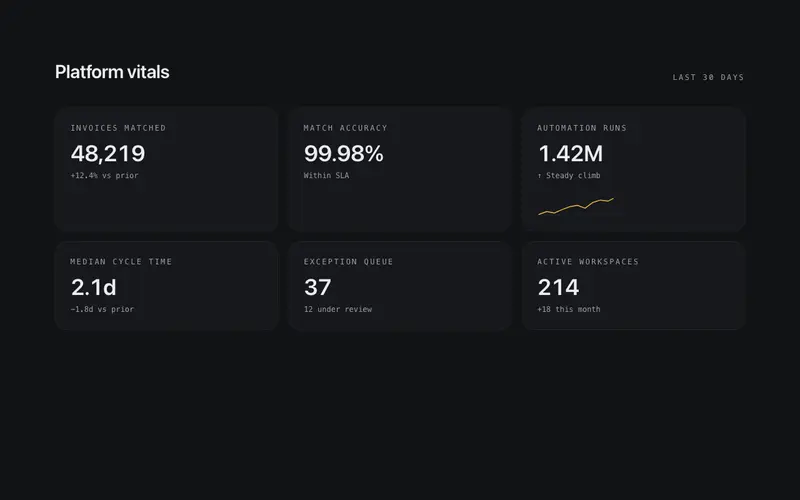
Live Board Stats
Instrument-panel grid of stat tiles, counting numerals over mono labels, with one tile carrying a tiny inline SVG sparkline drawn from deterministic prop data.
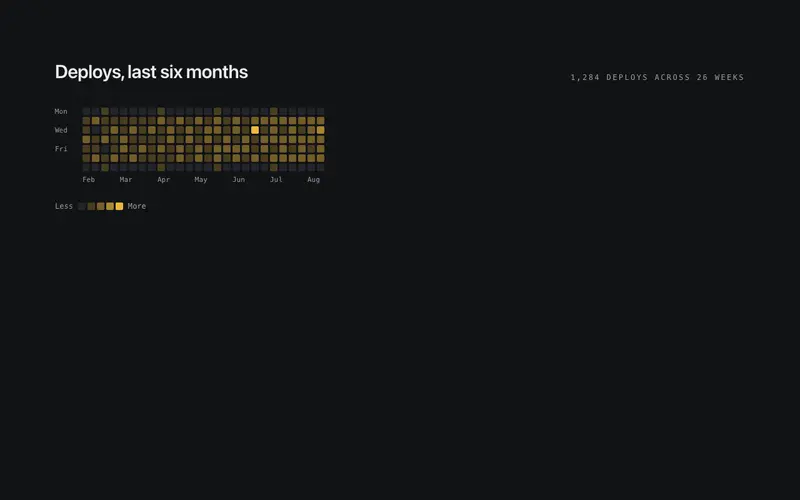
Stats Activity Grid
Contribution-style React activity heatmap, a dependency-free Tailwind grid of cells stepped through primary opacities, with mono axis labels and an honest text summary.
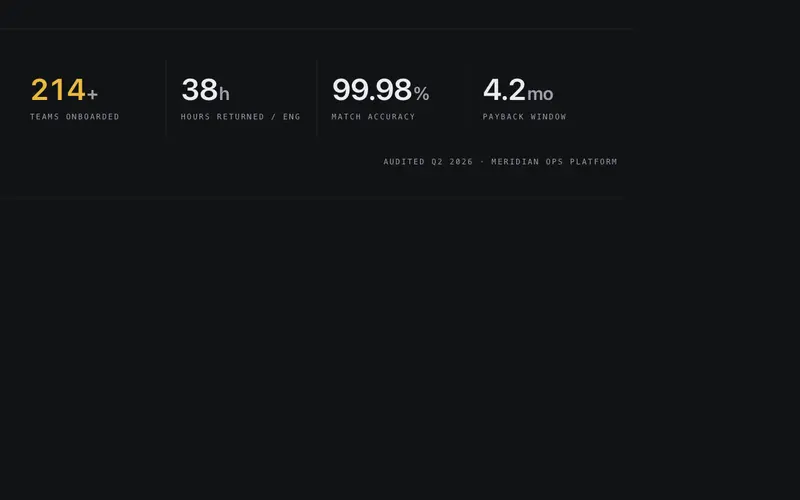
Stats Band
Full-width hairline band of three to five counting stats, tabular numerals tick up once on view over mono micro-labels, separated by vertical hairline seams.
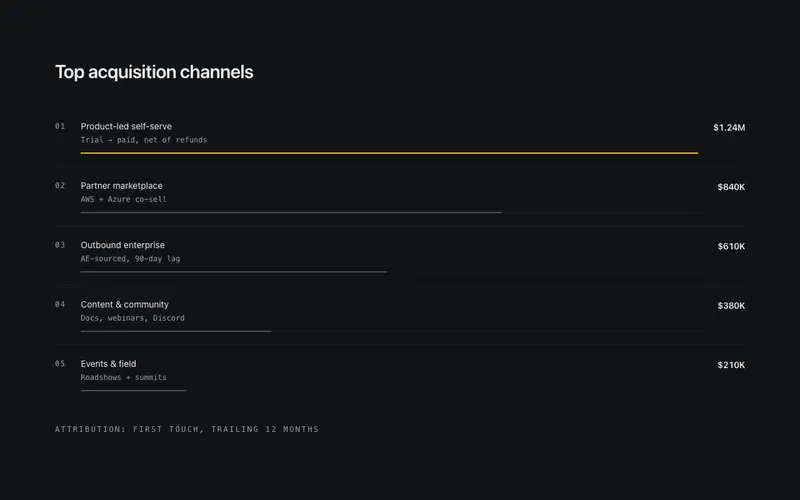
Stats Bar List
Ranked React stats ledger, each row pairs a mono index and preformatted value with a 2px Tailwind-token bar drawn to scale, the leading row carrying the accent.
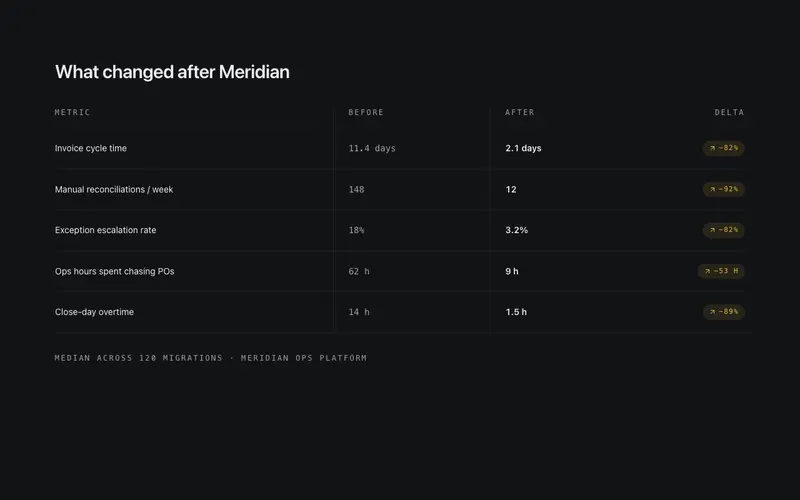
Stats Compare
Before-and-after metrics in two hairline columns, each row pairs the old number with the new one and settles a delta chip that quantifies the improvement.
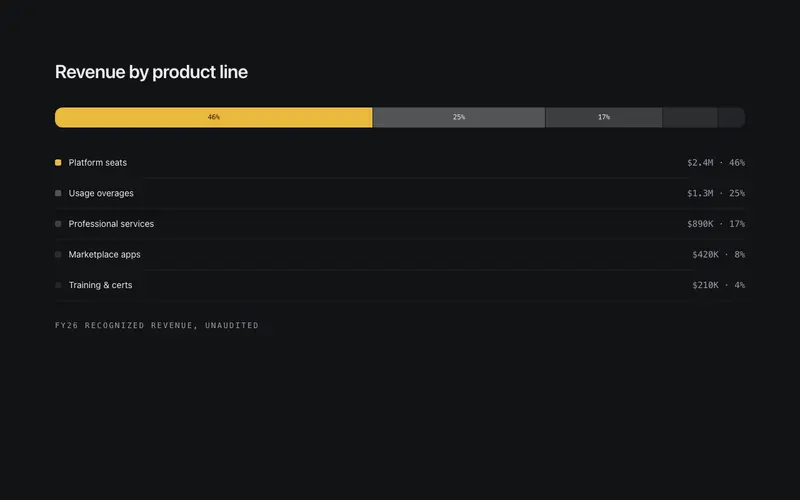
Stats Composition Bar
Part-to-whole React stat band, one Tailwind-token stacked bar splits into hairline-seamed segments with a legend ledger of preformatted shares beneath it.
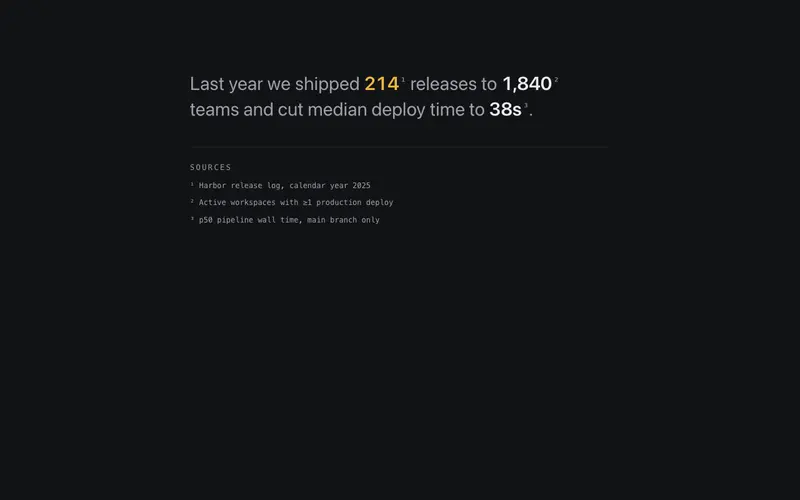
Stats Prose Inline
Editorial React stats paragraph, preformatted figures set inline in one flowing Tailwind sentence, with superscript footnote markers tied to a mono sources ledger.
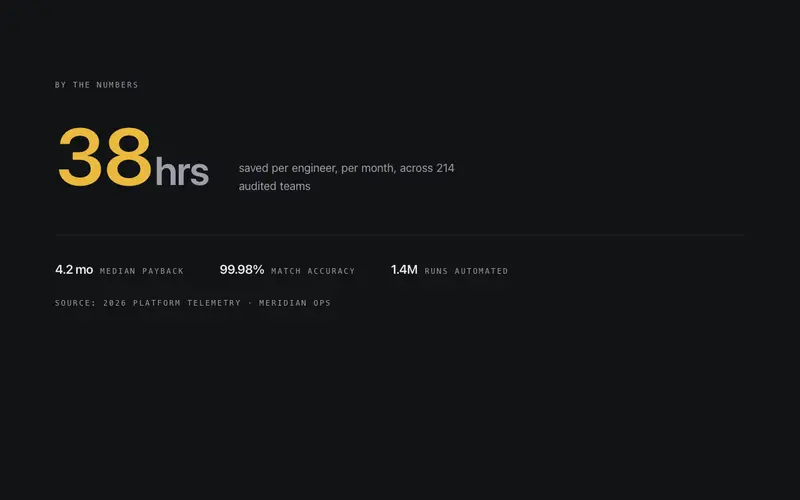
Stats Story
One hero stat set enormous with a sentence that gives it meaning, while secondary metrics wait quietly below a hairline, an editorial argument, not a dashboard.
Frequently asked questions
How many stats should a page lead with?
Three or four headline figures is the ceiling before they dilute each other, the stats band is deliberately sized for it. Deeper breakdowns belong in the bar list or composition bar further down, where interested readers self-select.
Can these components show live data?
Yes, the live board and activity grid re-render smoothly as props change, and the counters animate transitions. Wire them to polling or websockets in your data layer; presentation and transport stay separate.
What makes a stat credible versus decorative?
Specificity and provenance. "4,218 jobs completed" with a date beats "1000s of happy customers." The components include source and as-at slots, use them, because the layout visibly rewards real numbers over rounded claims.