Free React Number & Counter Components
Numbers are the most trusted content on a page, which is why they deserve better than a paragraph font. These six give figures their own typography and motion: an odometer that rolls digit-by-digit, a ticker for live-ish values, a radial gauge and segment meter for bounded metrics, a milestone row for company stats, and a delta chip for changes with direction. All use tabular numerals so columns align, and all animate on first view then get out of the way.
6 components · MIT licensed · installable with the shadcn CLI
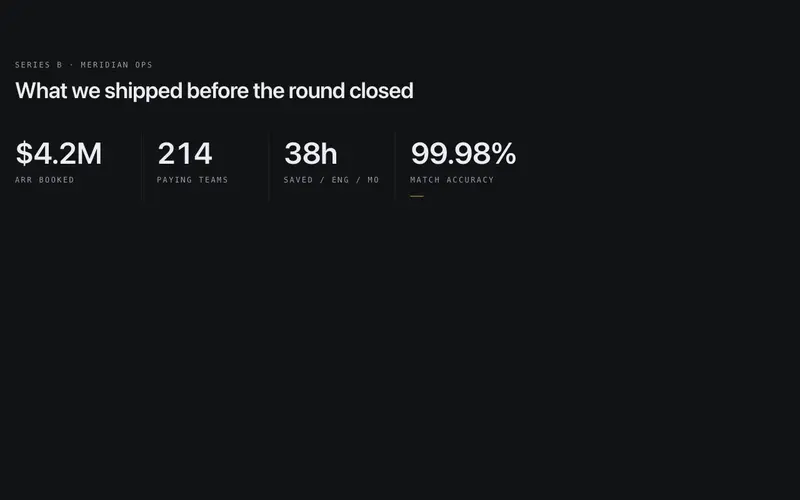
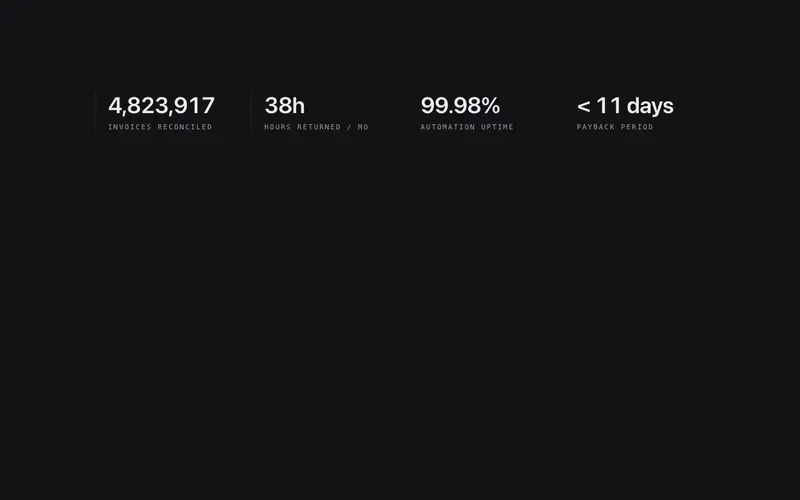
Number Milestone Row
A row of milestone numbers between hairline separators, each figure lands in sequence with a spring settle, and a primary tick draws itself under the final one.
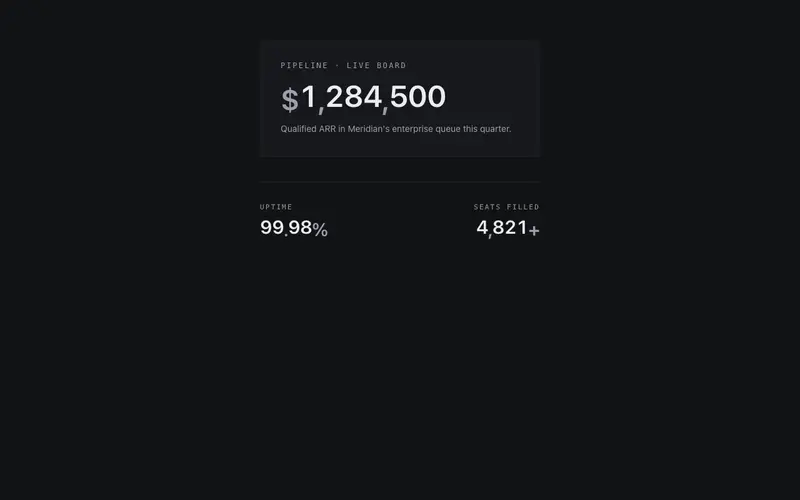
Number Odometer
Multi-digit odometer where every digit rolls inside its own masked column, settling right to left like a meter, with prefix, suffix, and decimal support.
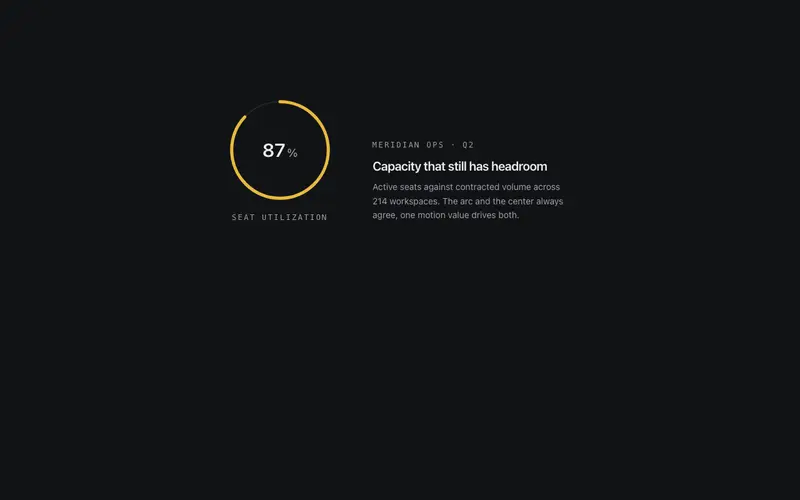
Number Radial Gauge
Determinate SVG radial gauge, a hairline token track, one primary arc drawn via pathLength, a tabular counted value at center and a mono label beneath.
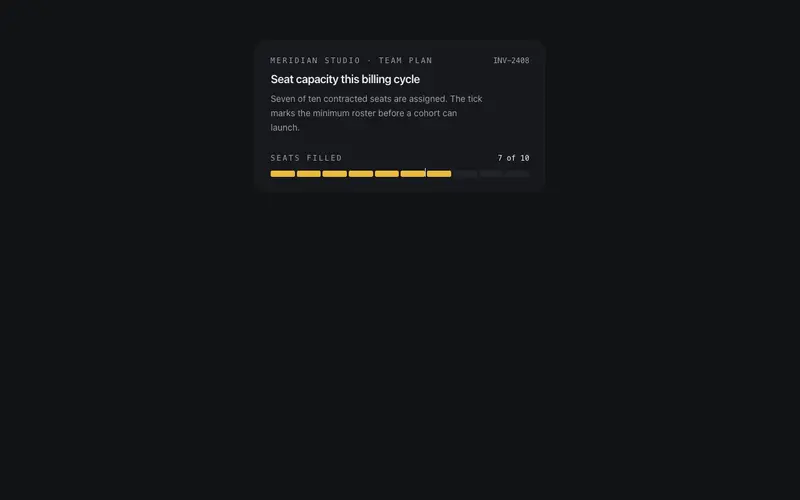
Number Segment Meter
Discrete React meter primitive, value-of-max rendered as Tailwind-token unit cells that fill in stepped sequence, with a mono fraction readout and threshold tick.
Number Ticker
Counts to a value once in view with an expo-out feel, fast start, precise landing. Locale-aware formatting, prefix and suffix, tabular numerals against layout shift.
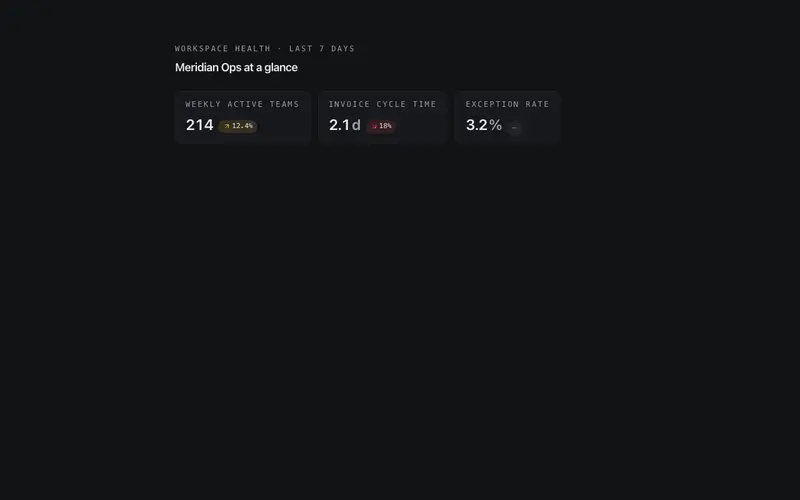
Stat Delta Chip
Compact metric chip pairing a counted-up value with a signed delta pill, direction glyph and token-honest color, primary for gains, destructive for losses.
Frequently asked questions
When should numbers animate and when should they not?
Animate once, on first view, to draw the eye, the components do this via IntersectionObserver and never replay on scroll. Dashboards showing changing data suit the ticker and delta chip; static claims suit the milestone row where a single count-up is plenty.
Why do the components insist on tabular numerals?
Proportional digits shift as values change, making animated numbers jitter and columns ragged. Tabular figures give every digit the same width, it is the difference between numbers that look designed and numbers that look pasted.
Can these display live data?
Yes, pass a new value prop and the odometer, ticker, and gauges animate the transition. Polling or websocket wiring stays in your data layer; the components just render whatever value arrives.